Visual Studio Code’s combination of functionality, customizability, and aesthetics makes it one of my favourite code editors. As such, I was set on making it work with embedded development since I was getting started with the STM32 line of microcontrollers. I was following the steps outlined in Mastering STM32 by Carmine Noviello (which is an excellent resource) until it said to use Eclipse, because life’s too short to use software with unnecessary bloat. Enter VS Code and someone wanting to use the latest and greatest in code editors.
The only thing that was keeping me away was the lack of out-of-the-box debugging compatibility. Fortunately, with VS Code’s debugging capability and my sunk-cost pain of figuring this out, getting this workflow going is fairly straightforward!
Prerequisites
Optional
- STM32CubeMX - For setting up projects. Now making makefiles!
- PlatformIO - A one-stop shop for setting up common hardware kits.
Note: The following was set up on Windows 10 for STM32 Nucleo F303K8. The Nucleo F030R8 was also tested and confirmed working with this setup.
Configuring VS Code
Open the Debug panel (CTRL + SHIFT + D) and select “Add Configuration > GDB” through the top left dropdown arrow. Create a GDB configuration in launch.json and add the following. Note: Change the paths in “target”, “gdbpath”, and “autorun” to the correct locations.
{
   "name": "GDB",
   "type": "gdb",
   "request": "launch",
   "cwd": "${workspaceRoot}",
   "target": "${workspaceRoot}/.pioenvs/nucleo_f303k8/firmware.elf",
   "gdbpath" : "C:/STM32Toolchain/gcc-arm/5.4 2016q3/bin/arm-none-eabi-gdb.exe",
   "autorun": [
   	"target remote localhost:3333",
   	"symbol-file ./.pioenvs/nucleo_f303k8/firmware.elf",
   	"monitor reset"
   ]
}
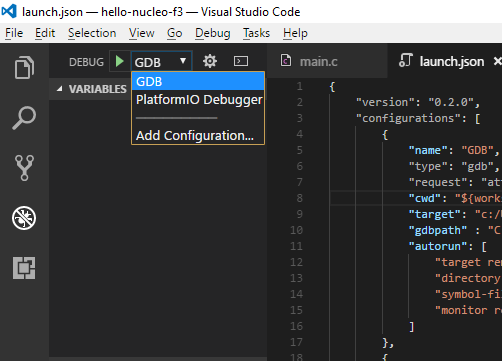
GDB debugger entry added after successfuly entry in launch.json file.
Starting a Debug Session
Before entering debug mode (F5), you need to launch the OpenOCD server. Open Terminal in VS Code (CTRL + ` ) and type:
openocd -f board\st_nucleo_f3.cfg

Adding breakpoints and stepping through code on an STM32 through VS Code!
Unfortunately you must always start the OpenOCD server before hitting F5, but fortunately you can just hit Up in the terminal to recall the last command.
Troubleshooting
When running OpenOCD, the following error might come up:
Error: libusb_open() failed with LIBUSB_ERROR_NOT_SUPPORTED
Use Zadig to upgrade ST-Link Debug to the correct WinUSB driver. Enable through Options > List All
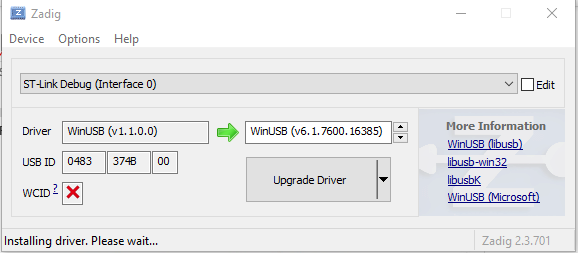
Fixing faulty USB drivers on Windows 10.
Happy debugging!