Featured on MagPi Issue 72, Hackaday, Hacker News, Adafruit, Hackster.io and The Guardian!
Bread, the quintessence of life. People have survived for centuries off this staple consisting only of flour, water, salt, and yeast. Try consuming all these ingredients separately, and you’ll be in for a digestive surprise. However, mix them together and let time do its thing, and the result is the release of profound flavour, texture, and nutrients that were previously locked away.
Despite it being relatively easy to turn dough into something that looks and feels like bread, the challenge is in squeezing every possible ounce of flavour and texture (using only those four ingredients) to achieve the embodiment of a true loaf of bread. The secret to artisinal bread is all in the fermentation. A baker’s skill is in their ability to manage and control the fermentation process, which is usually achieved through countless months and/or years of trial and error.
But what if there was a better way to understand what happens during the fermentation process?
In this blog post, we dive into the world of wild yeast (commonly known as sourdough starter) by tracking its growth through timelapses, automated image analysis, and cool graph animations. Read on to find out more!
Timelapse taken over ~10 hours at 5 minute intervals. Shown: Two sourdough starters with different feeding ratios.
Image analysis for tracking growth of the above timelapse.
The Backstory
Two key components in making artisinal bread are time and fermentation. If you can afford a long, slow rise, you will be rewarded with a texture like no other, and flavours that are both complex and subtle. Most bakeries unfortunately do not have this luxury (since it’s a business after all), so commercial instant dry yeast is used to expedite the fermentation such that it reaches the desired loaf volume at a reasonable schedule. With bread risen with instant dry yeast, it will definitely resemble visual qualities of bread, but the texture and taste will not be comparable to bread that uses wild yeast.
The quest for achieving the perfect loaf is an arduous one. It can take upwards of 12 hours from the first mix to actually being able to bake the loaf, and environmental factors (ie. temperature and humidity) can alter the dough’s behaviour (ie. in how it absorbs water, or how fast/slow the fermentation occurs). With every loaf being slightly different, it can be challenging to identify what processes need adjusting to get one step closer to that perfect loaf.
For context, a typical process for making an artisinal loaf is roughly described below:
- Discard 80-90% of the sourdough starter and feed it with flour and water.
- Wait a few hours for the starter to ferment and double or triple in size.
- At its peak, take the starter and mix it in with the rest of the bread ingredients.
- Gently fold the dough to tighten it up (which creates the gluten) a few times for the first 1-2 hours.
- Let rest. Flavours are developed during this bulk fermentation period.
- Shape the loaf and place it in a proofing basket.
- Let rest. The final volume is achieved during this second fermentation.
- Bake.
- Place on cooling rack when done, and listen to the song of the crackling crust while you wait to cut it open.
Sourdough starter is a living organism, and as such should be treated with kindness, respect, and most importantly, food. A well-fed starter is an active and happy one; if we can get a feel for how the starter behaves on a day-to-day basis during its feeding (ie. when the fermentation occurs), it may help clear up at least one of the variables in bread baking.
One way to achieve this understanding is simply through trial and error. But we can do better. We can use (rather simple) computer vision!
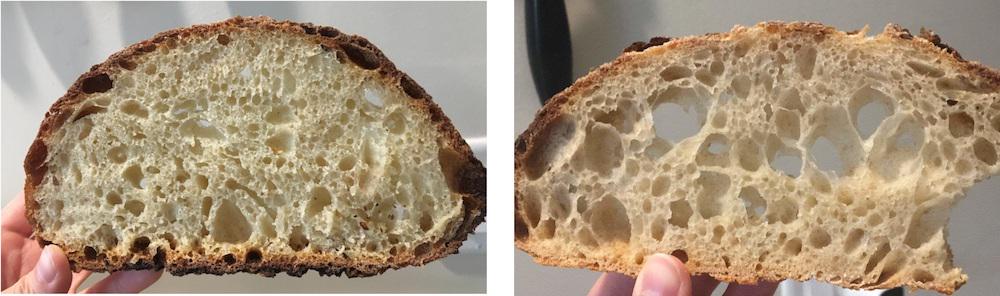
The loaf’s holey texture (ie. the elusive open crumb) is largely determined by activeness of the starter, so this is where we shall put our initial efforts. Specifically, we want to understand:
- When the starter reaches its maximum fermentation,
- How consistent the starter’s fermentation is, and
- What happens when the starter is neglected and how quickly it can come back to life.
To answer these questions, our plan of action is to:
- Take a timelapse of starter
- Write an image analysis script to locate the current height of the starter in each image
- Plot the height over time to get its growth characteristics
Enough with the walls of text. Let’s get on to the fun stuff!
The Development
Setting Up the Timelapse
For ease and convenience, the timelapse was set up on a Raspberry Pi. I initially had the idea to eventually create a real-time analysis of the starter (ie. a Python script updating a locally hosted dashboard), but I figured post processing a timelapse was good enough for now to answer those questions. You can pretty much use any camera to take a timelapse.
Loading the Raspberry Pi Zero (Headless)
Setting up a Raspberry Pi is very easy these days:
The only hiccup I ran into was setting up without any monitor or ethernet attached, so getting it connected to WiFi and retrieving its IP address was non-trivial. Luckily, other people had run into the same problem over at the Raspberry Pi forums. The solution:
- Create an empty file on the SD’s boot partition called
sshto enable it. - Create another file named
wpa_supplicant.confwith the following content:
country=US
ctrl_interface=DIR=/var/run/wpa_supplicant GROUP=netdev
update_config=1

network={
    ssid="your_real_wifi_ssid"
    scan_ssid=1
    psk="your_real_password"
    key_mgmt=WPA-PSK
}
Connect the camera module and boot it up. You can use something like Angry IP Scanner to find its IP address, and with any luck you should be able to SSH into it from your own computer!
Creating the Scripts
Fortunately, the Pi comes loaded with raspistill, a command line tool to capture images (see here for documentation). All we need to do is to write a simple shell script to execute this command every N seconds to create a timelapse.
Note: The easiest option is to use the built in timelapse mode. However, I decided to make my own script to have more control over the filenames and where the images get saved.
Folder Structure
I set up two scripts, one to take the timelapses, and another to start the timelapse as a background process. The run script is in the home directory so I can execute the command right when I login through the command line.
    home/pi/
    ├── sourdough-monitor/
    │   ├── imgs/
    │   └── timelapse.sh
    └── run_sourdough_monitor.sh
Scripts
In timelapse.sh:
#!/bin/bash
# Calls 'raspistill' every 300s (ie. 5 mins) and writes the images
# to a new date/timestamped folder.

TOTAL_DELAY=300 # in seconds
CAM_DELAY=1 # need to have a nonzero delay for raspistill

# Must be 1.33 ratio
RES_W=1440
RES_H=1080

# Calculate the total delay time per cycle
SLEEP_DELAY=$(($TOTAL_DELAY-$CAM_DELAY))

FOLDER_NAME=imgs
mkdir -p $FOLDER_NAME # create image root folder if not exist

IDX=0 # image index

function cleanup() {
        echo "Exiting."
        exit 0
}

trap cleanup INT

while true; do
        DATE=$(date +%Y-%m-%d_%H-%M-%S)
        FNAME="${DATE}_(${IDX})" # image filename

        # Create folder for current timelapse set
        if [ $IDX -eq 0 ]
        then
                FOLDER_NAME=$FOLDER_NAME/$DATE
                mkdir -p $FOLDER_NAME
                echo "Created folder: ${FOLDER_NAME}"
        fi
        # Take image
        raspistill --nopreview -t $CAM_DELAY -o ./$FOLDER_NAME/$FNAME.jpg -w $RES_W -h $RES_H

        echo "Captured: ${FNAME}"
        IDX=$((IDX+1))
        sleep $SLEEP_DELAY
done
And in run_sourdough_monitor.sh:
#!/bin/bash
# Convenience script to run the monitor from home directory and launch
# in background

cd sourdough-monitor

# Start in background so ssh session can be closed
nohup ./timelapse.sh &> /dev/null &
Nothing fancy here, so let’s move along.
Taking the Timelapses
Sometimes having kludgy setups is the best way forward. Might not be as pretty, but when bread is on the menu then nothing else matters. All we’re here for is the data!
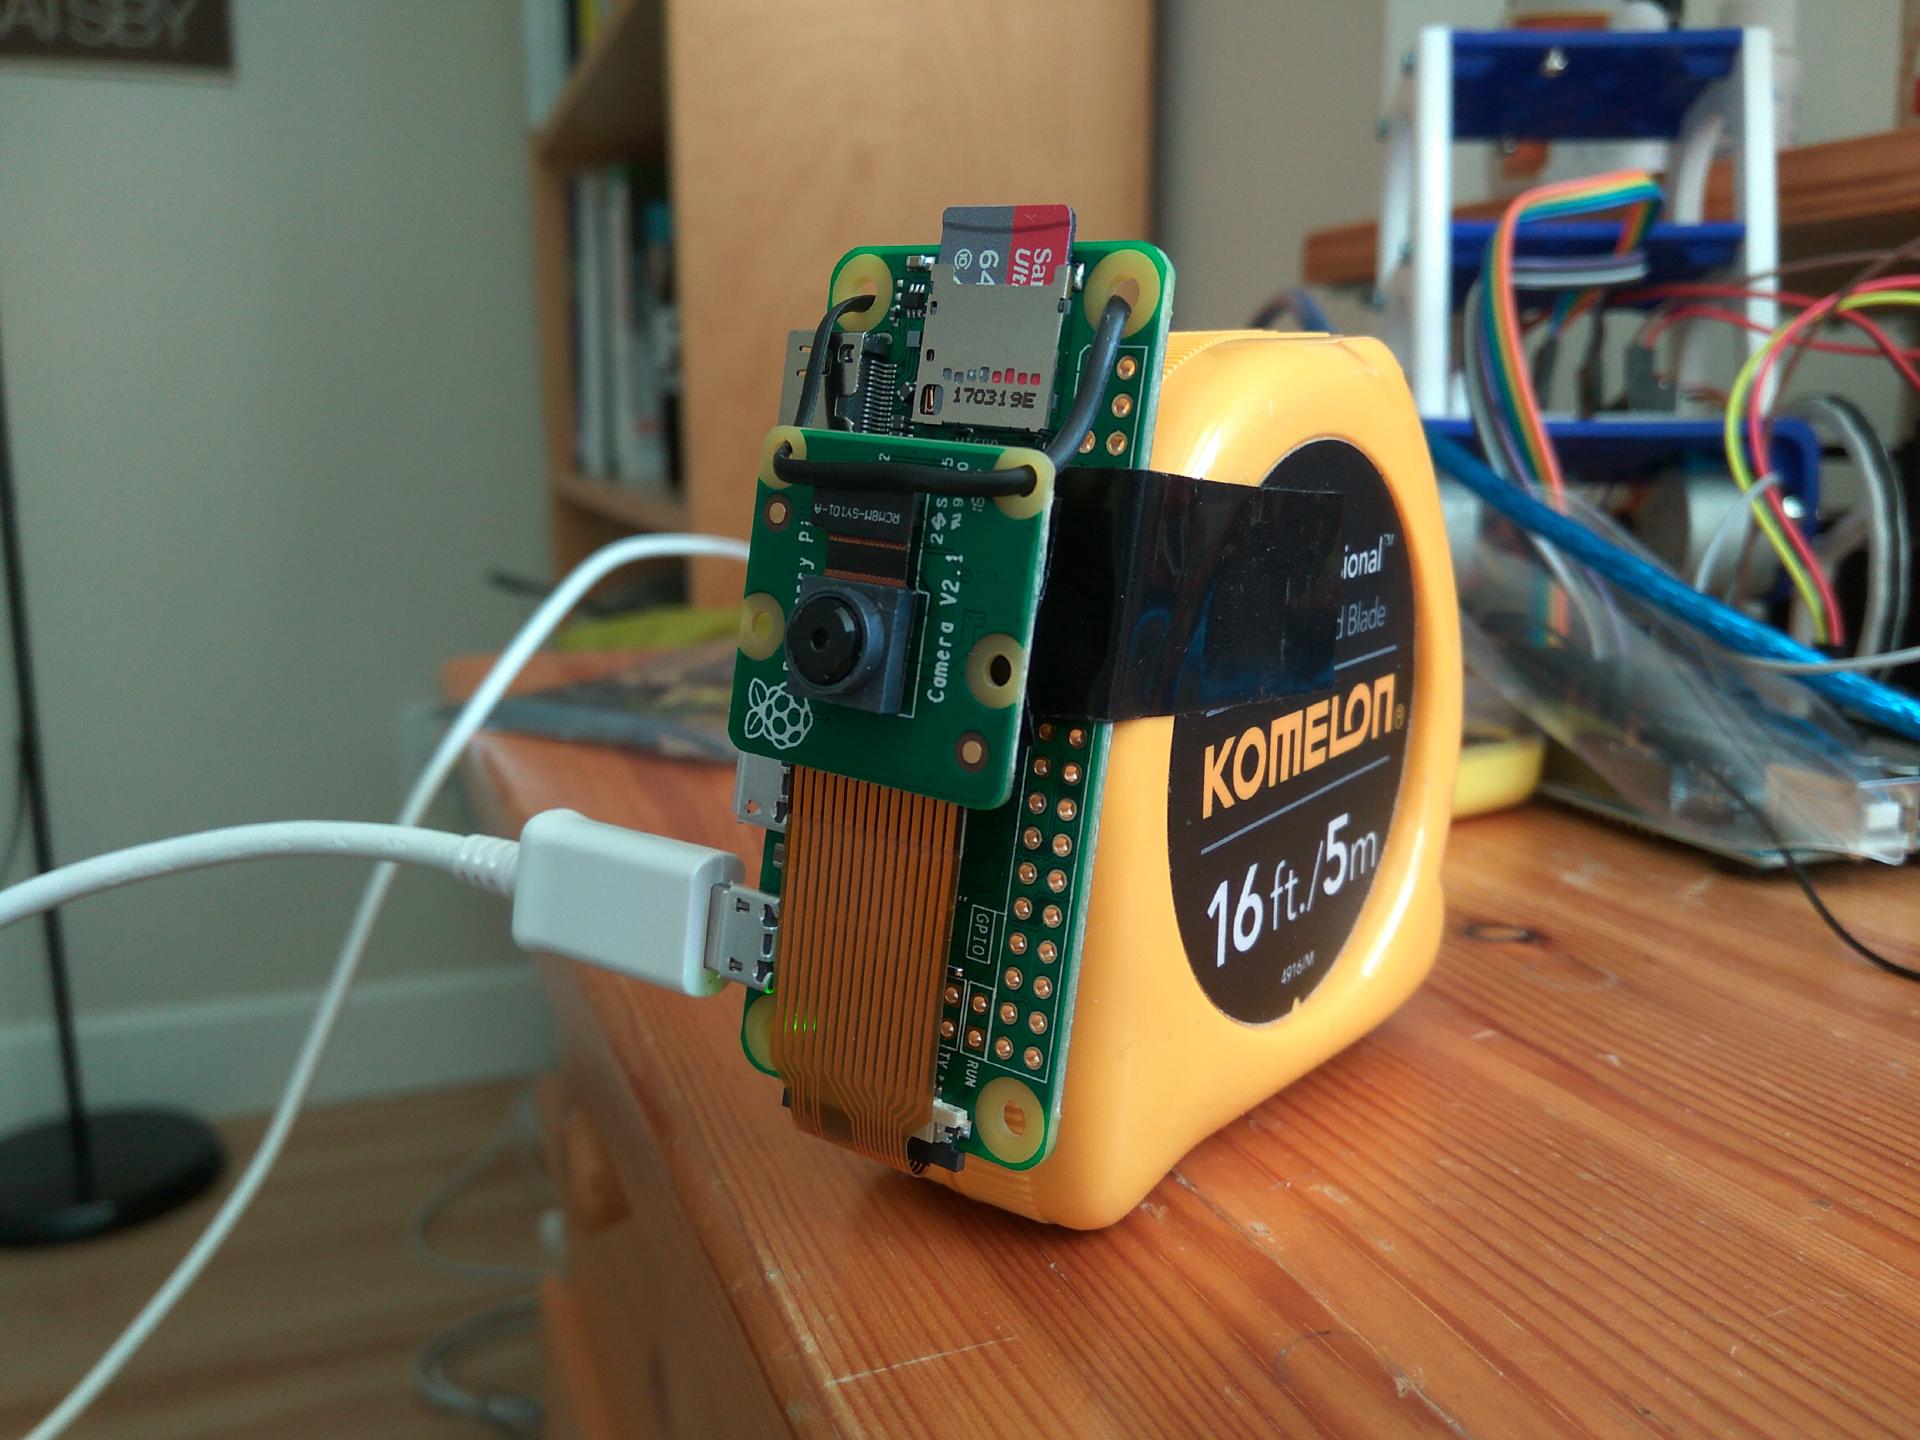
Sometimes random parts and a bit of tape are the best way forward.
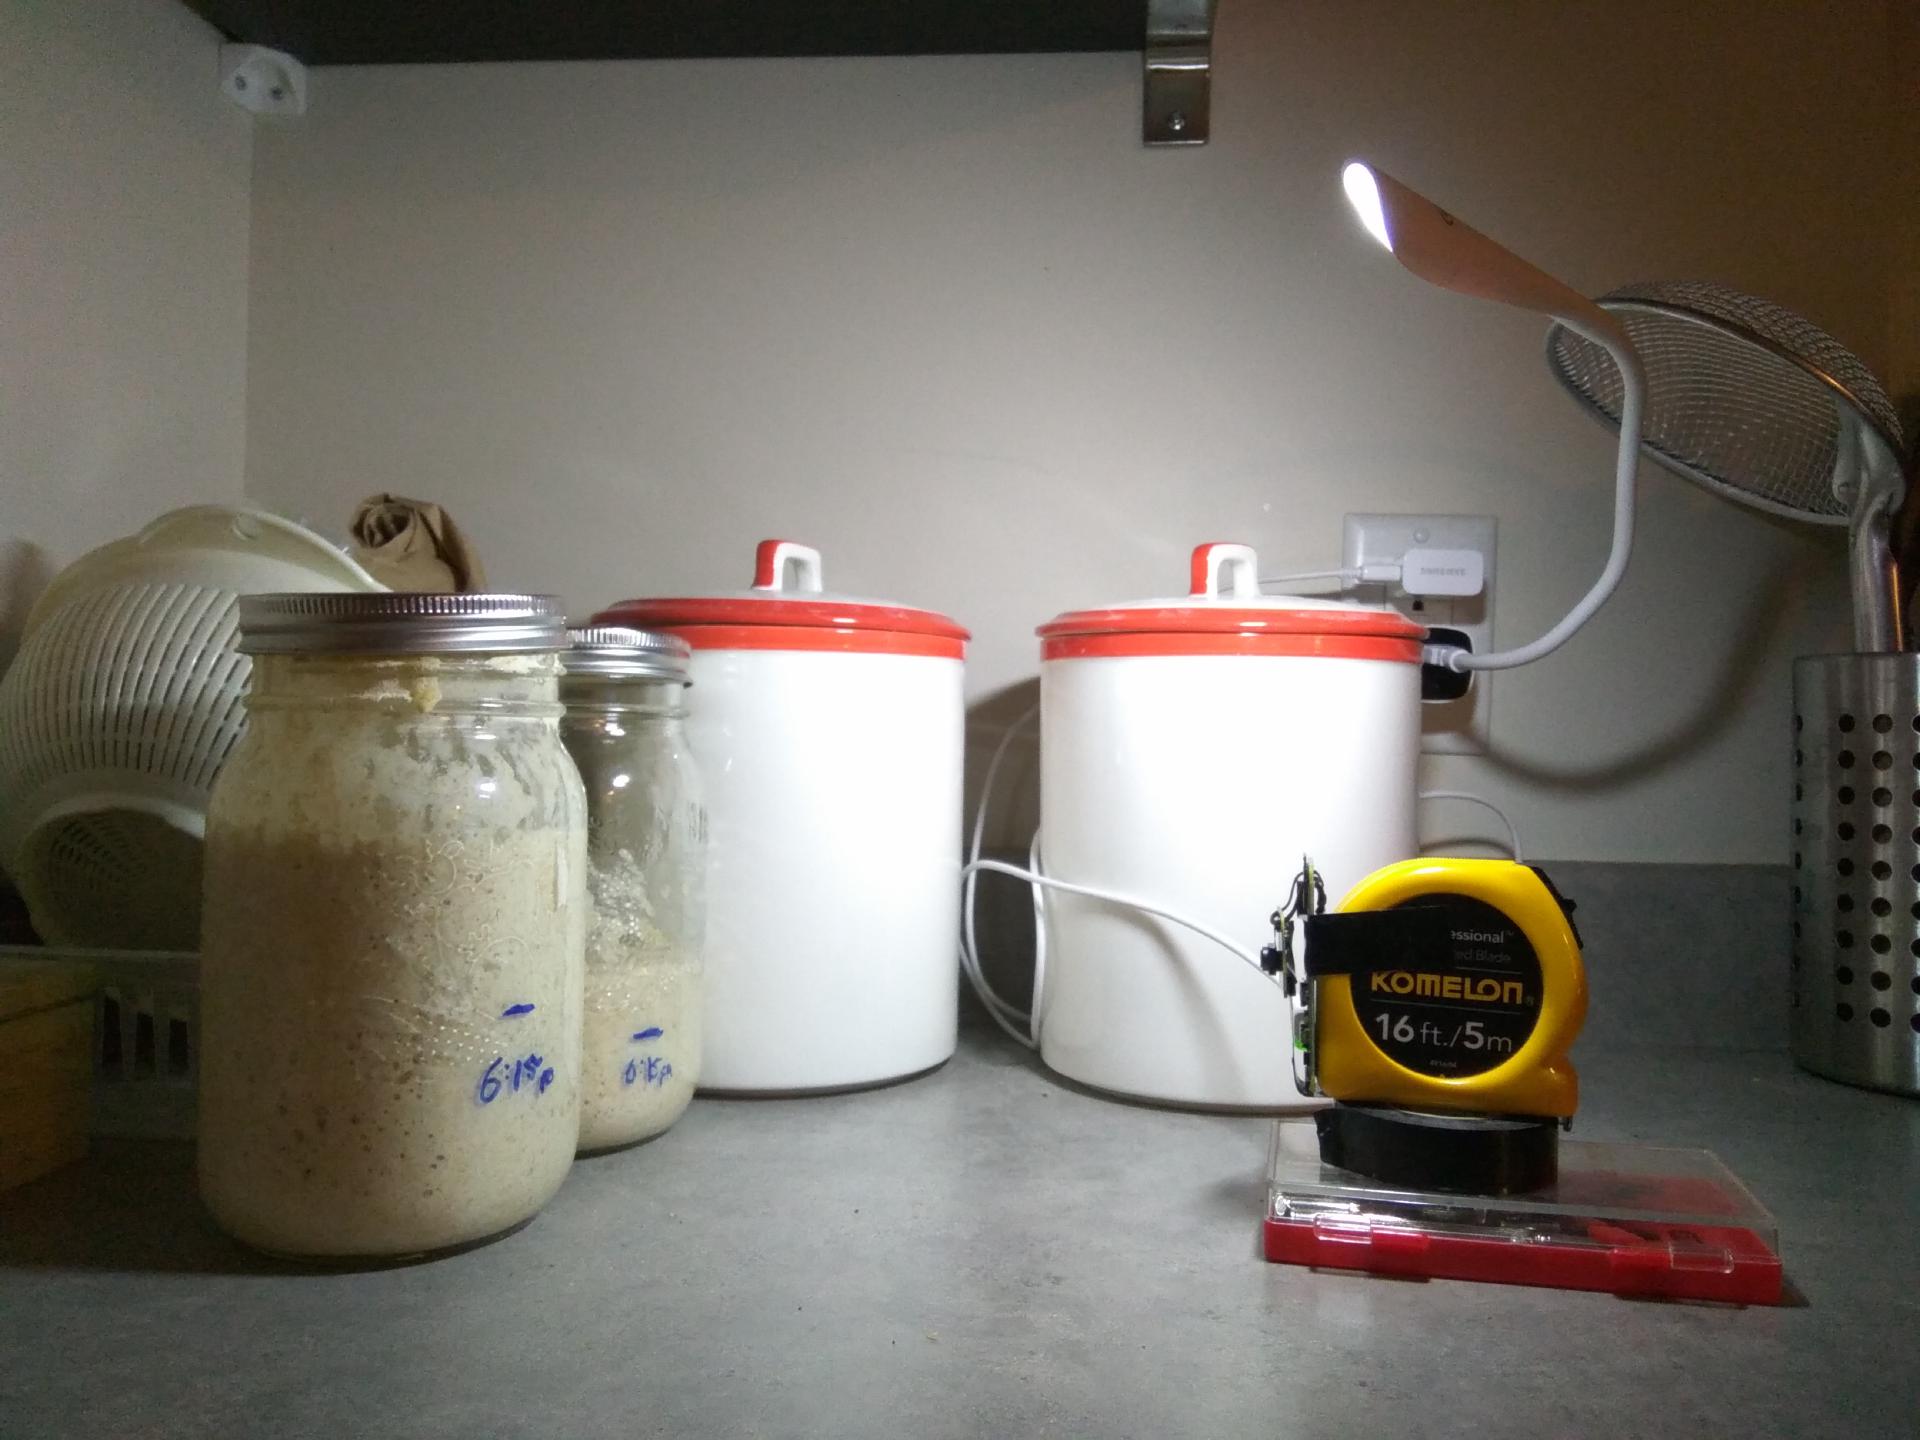
The light was originally placed in front (as shown above), but a better method was to put the light behind the jars to maximize contrast and minimize glare.
To start the timelapse, ssh into the Pi and execute the following:
$ ./run_sourdough_monitor.sh
The next morning, you can ssh back in and kill the process with:
$ pkill timelapse
Once you have it set up on the Pi, you can also control it with your phone and something like JuiceSSH to feel super techy.
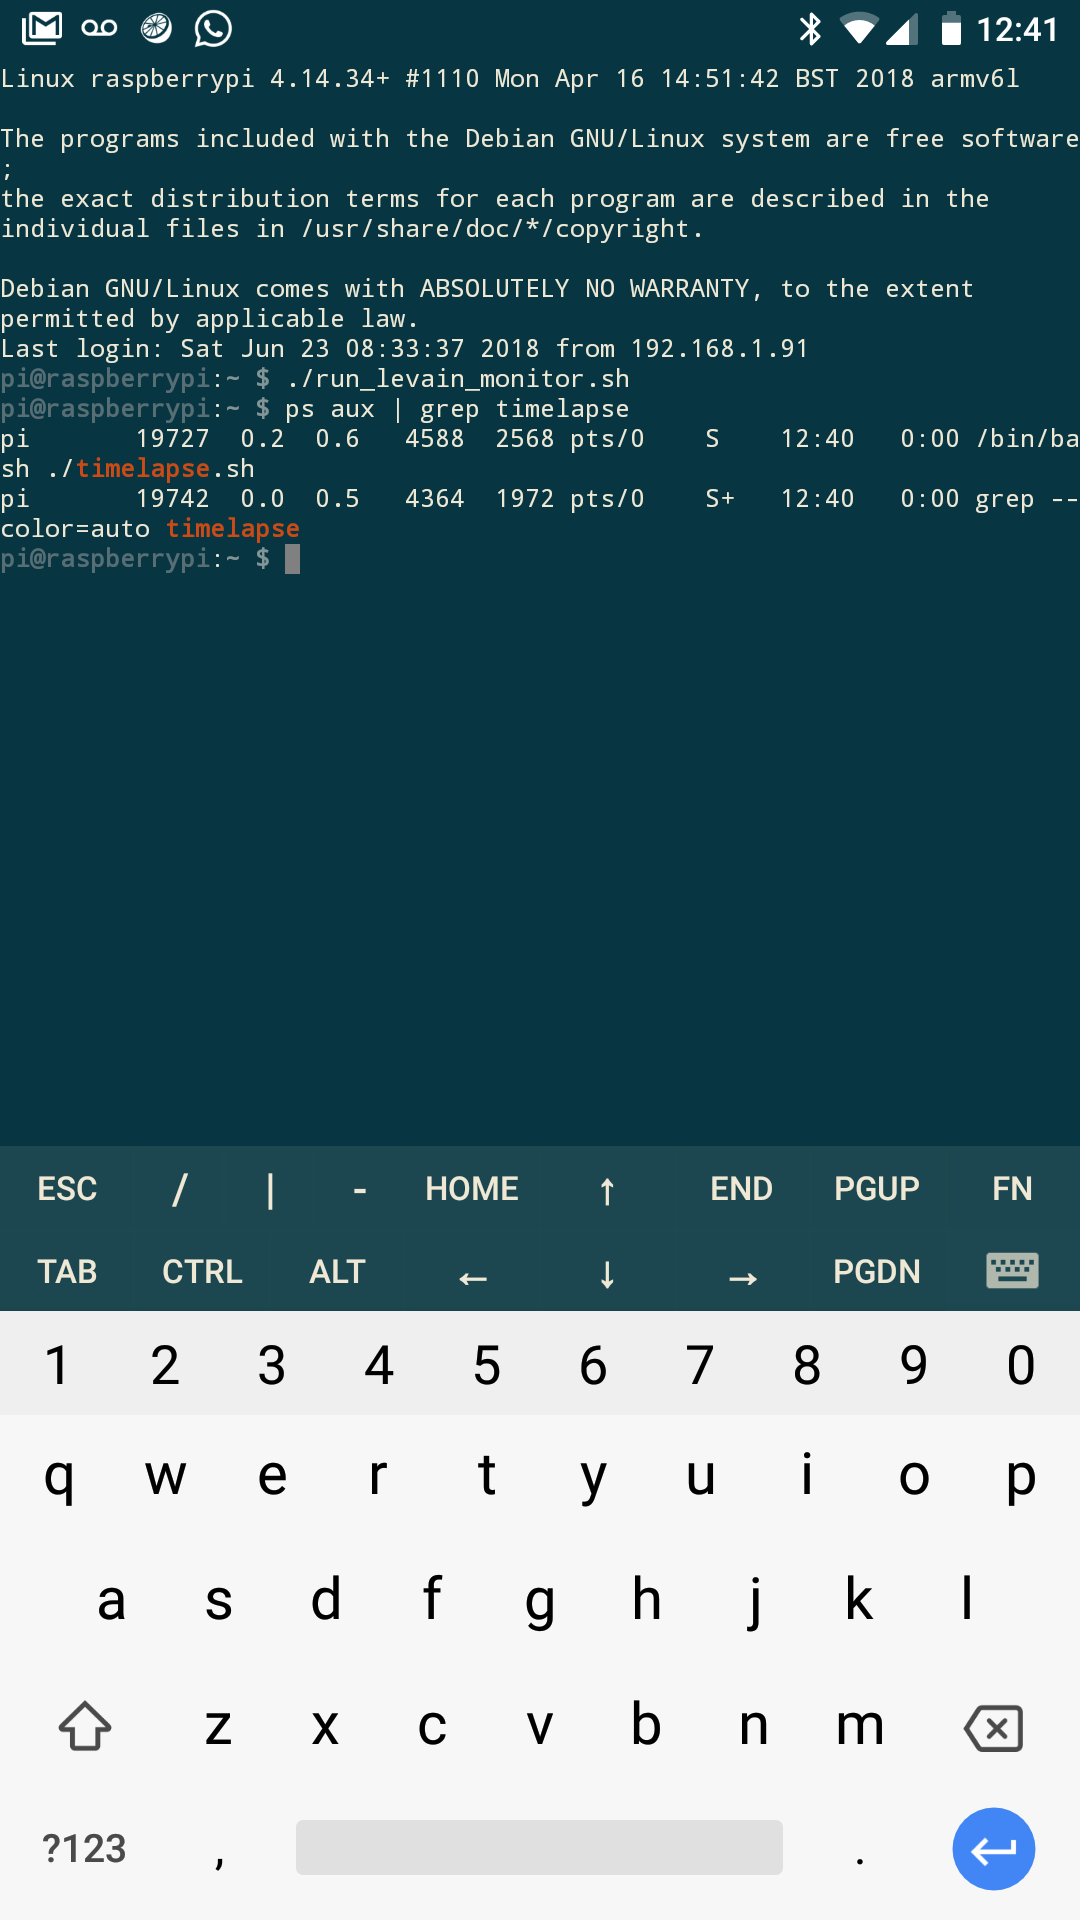
Starting the timelapse on Android, because why not?
Now we have some data to analyze!
The Analysis
The computer vision part of this project was quite straightforward, thanks to scikit-learn. All we have to do is to:
- Apply a binary threshold to the image to get two distinct regions
- Find the location of the boundary line
Fortunately, these are very easy to do with this library! The two main required components:
- skimage.filters - For applying thresholds
- skimage.measure - For measuring region properties
Everything discussed in this blog post is also available on my Github.
Thresholding the Image
There are many threshold algorithms to choose from, and fortunately scikit-learn comes with a handy function to try them all at once.
import matplotlib.pyplot as plt
from skimage.filters import try_all_threshold

img = io.imread('2018-05-31 Levain Timelapse/test.jpg', as_grey=True)
img = img[0:1000, 650:1100]   # crop image to zoom in to jar

fig, ax = try_all_threshold(img, figsize=(10, 8), verbose=False)
plt.show()
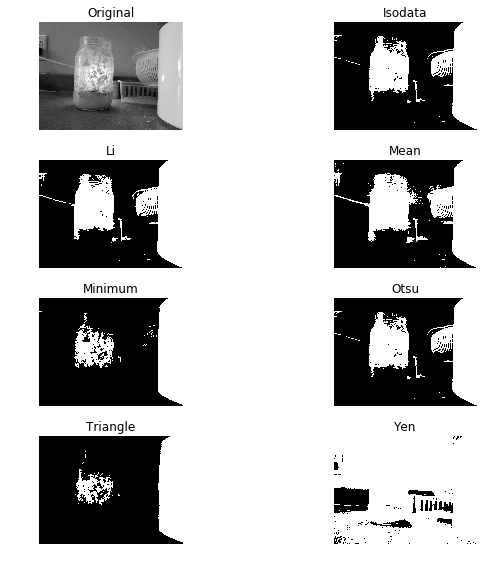
Running the above code yields the following image:
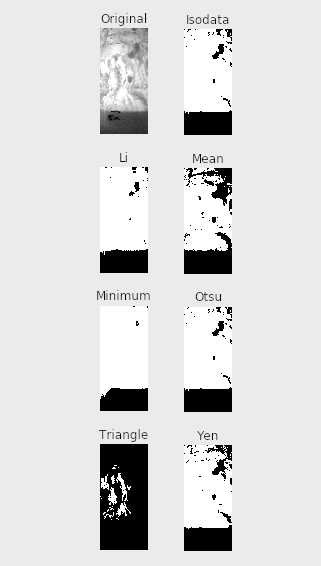
The try_all_threshold() function is fast and convenient to see which will likely be the best for an image.
Discussing the different thresholding algorithms is beyond the scope of this post, but what we’re looking for is one that is able to separate the boundary between the clear glass jar and the opaque sourdough starter. From the image above, it looks like isodata, otsu, and yen provide the sharpest thresholded boundary.
Given a hot tip from my coworker (thanks Andreas) that Otsu’s method is a good one to pick, we can dig deeper into it. From the docs:
Otsu’s method calculates an “optimal” threshold (marked by a red line in the histogram below) by maximizing the variance between two classes of pixels, which are separated by the threshold. Equivalently, this threshold minimizes the intra-class variance. - SciKit Image Docs
The main takeaway with Otsu’s method is that it works best with a bimodal distribution. For our image, this means the histogram should be represented by two distinct peaks. Since our cropped image looks to have two visually different areas (ie. transparent glass at the top, flour/water mixture at the bottom), let’s confirm that this method will work.
plt.hist(img.ravel(), bins=256, range=(0.0, 1.0), fc='k', ec='k')
plt.title('Histogram of Original Image')
plt.show()
Plotting the histogram yields the following result:
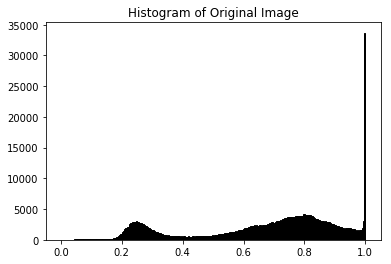
The image is a bimodal histogram, so Otsu’s method should work well. (Please forgive my unlabelled axes.)
Great, the histogram shows just what we need! (Except for the high concentration of saturated pixels, but let’s just ignore that for now…)
Taking a closer look at the thresholded image:
from skimage.filters import threshold_otsu

thresh = threshold_otsu(img, nbins=5)
binary_img = img < thresh

fig, axes = plt.subplots(ncols=2)
ax = axes.ravel()

ax[0].imshow(img, cmap=plt.cm.gray)
ax[0].set_title('Original image')

ax[1].imshow(binary_img, cmap=plt.cm.gray)
ax[1].set_title('Result')

plt.show()
The result of Otsu’s thresholding method.
Those white blobs on the walls of the jar may still be detected as regions of interest, but applying a minimum thresholded area will help with false positives. Luckily, we have moderate control of the lighting and contrast of the object in question. If we’re lucky we won’t have to change much for the timelapses taken at different times of the day!
Quantifying the Image
With our binary image, we can now use skimage.measure to easily get quantified properties of the regions. Full list of properties can be found in the docs.
height = None

fig, ax = plt.subplots()
ax.imshow(binary_img, cmap=plt.cm.gray)

label_img = label(binary_img)
regions = regionprops(label_img)

for props in regions:
    y0, x0 = props.centroid

    minr, minc, maxr, maxc = props.bbox
    bx = (minc, maxc, maxc, minc, minc)
    by = (minr, minr, maxr, maxr, minr)

    area = (maxc-minc)*(maxr-minr)

    if area >= min_area:
        # Plot the bounding box
        ax.plot(bx, by, '-b', linewidth=2.5)
        # Plot the centroid
        ax.plot(x0, y0, 'ro')
        height = minr

plt.show()
The resultant image below shows how multiple areas are detected and classified. However, we can apply some RI(TM) (aka. real intelligence) to only pick the region of the sourdough starter. There are many ways to do this, but the simplest was to simply set a minimum area requirement. As long as it’s high enough, it should ignore all the other regions.
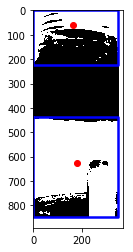
Minimum area is required since other areas will register as a detected region.
Due to the camera perspective and curvature of the jar, the boundary between the two regions is not actually straight. This was solved by taking a much narrower cropped region, which you will see below in the animated timelapses.
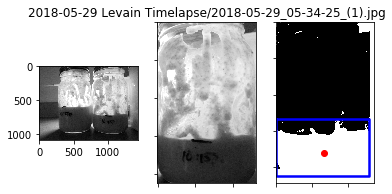
This may have been a bit easier with a square container…
Now that we have a working understanding of the components we need, let’s get scripting and collect a bunch of data! You can check out the full analysis on Github.
The Results
The timelapses below show the sourdough starter from different dates. The boundary tracking algorithm is reasonably well at detecting the correct height, but there are occasional outliers that cause the errors. However, the overall trend of the growth is still captured.
May 29, Left Jar
The rise on the left jar had the cleanest growth trace.
May 29, Right Jar
A narrow crop area had to be used to prevent detection of uneven rise levels.
May 31, First Feeding
Sunlight through the kitchen window created glare on the bottom left area on the jar, which affected the binary thresholding.
May 31, Second Feeding
Having the jar farther away reduced the thresholding accuracy, but the overall trace was still acceptable.
June 10, Out of Fridge
A larger jar was needed for this one! The thresholding algorithm was surprisingly still able ot catch the peak to some extent, despite minimal contrast.
June 23, First Feeding
After some neglect, the starter only rose to ~50%...
June 23, Refeeding
But after another feeding the next morning, it had enough activity to spring back ~80% growth!
The Discussion
The animations are cool to watch, but what can we interpret from it? Plotting all the growths (as shown below), we see that they seem more similar than different. The peaks hover around 60-80%, and the rate of growth coming up to the peak are similar.
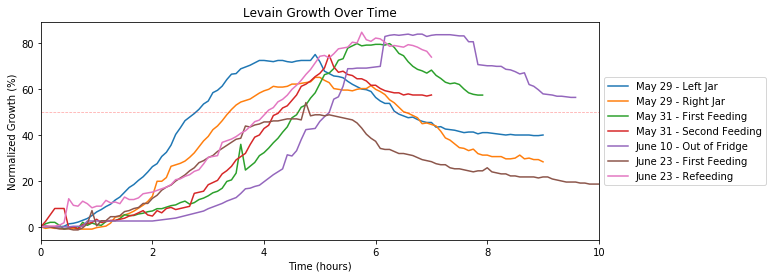
All the timelapses plotted to compare normalized growth. Horizontal dotted line indicates 50% mark.
Effect of Regular Feeding
Taking only a select number of days, there is a clearer trend to be seen. The graph below shows how the growth magnitude and rate increases over frequent and regularly scheduled feedings.
On May 29th, we began to feed our sourdough starter after many months of sporadic feeding. With the June 10th growth, the ramp up occured later but eventually rises to ~80%. The ideal growth target is to double or triple in size, but hopefully that time will come with even more regular feeding.
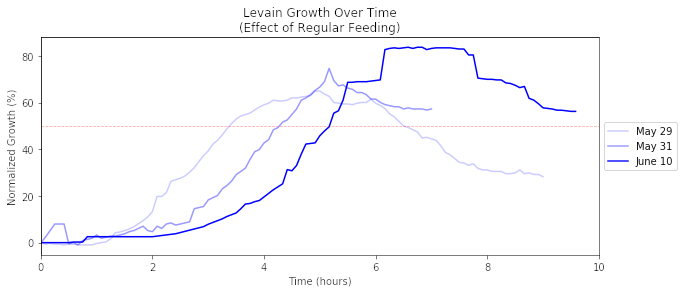
We can see that regularly feeding the sourdough starter greatly increases its rate and growth.
Note: The time delay of each subsequent feeding is not a result of regularity, but rather because the starter to food ratio was reduced over time to promote a more active fermentation. We eventually migrated to a 50g starter + 100g water + 100g flour (50 / 50 white and whole wheat). The starter has more potential for growth by beginning with less starter and more food, but as a result it may take a bit longer for the bacteria to vigorously start multiplying.
Bringing the Starter Back to Life
Previous to June 23, the starter was neglected for a week. After the first (overnight) feeding, it showed little signs of growth. However, feeding it again around noon and tracking its progress shows that the growth springs back up to ~80%, which was around the previous maximum from before.
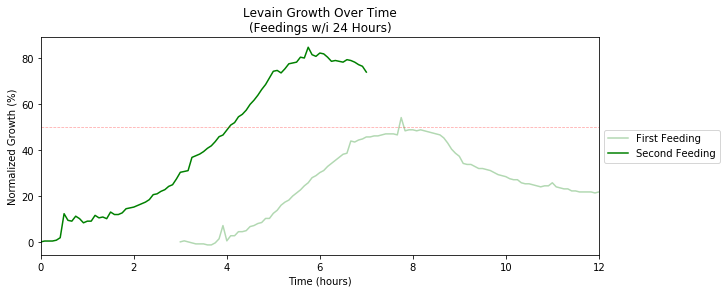
What doesn't kill you makes you stronger (or at least as strong as before). First feeding is shifted because I forgot to start the timelapse right away.
Thus, a bit of neglect seems to be okay since the starter appears to be fairly resilient to starvation! (But if you’re going on vacation, please feed it more than you typically would so it can sustain itself in your absence.)
The Conclusion
So what can we take away from ~40 hours of watching yeast rise1? From all this, we learned:
- The rate of growth appears to be fairly consistent, even with poorly maintained starters
- A healthy, regularly fed starter reaches maximum fermentation growth after 5-6 hours.
- The peak has a ~1 hour window for when it should be used
- Regularly feeding a neglected starter will make it (and you) happy again
Even just taking a timelapse will give you a good feel for how your starter behaves, especially when you’re starting out with baking bread. If you leave it overnight and come back the next morning to what looks like minimal growth, a timelapse can tell you if it peaked 3 hours in without you noticing, or if it actually didn’t grow. Every starter is different, but if you can give it the attention it deserves, its fermentation will continually reward you with loaves like no other.
Happy baking!
Further Reading
Check out the links below to level-up your bread game. (I may make profit from the Amazon (affiliate) links below, but not the other ones. Those just have good content that I support!)
- Alex French Guy Cooking’s Guide to Sourdough (YouTube)
- Trevor J. Wilson’s Open Crumb Mastery (Breadwerx, YouTube)
- Tartine Bread (Amazon)
- Flour Water Salt Yeast: The Fundamentals of Artisan Bread and Pizza (Amazon)
- My Bread: The Revolutionary No-Work, No-Knead Method (Amazon)
Disclaimer: justinmklam.com is a participant in the Amazon Services LLC Associates Program, an affiliate advertising program designed to provide a means for sites to earn advertising fees by advertising and linking to Amazon.com.
Which, for the record, is much more interesting than watching paint dry. ↩︎